The challenge
Construction programmes are planned and tracked in Primavera P6. The schedule holds the truth about what should happen and when, but turning it into the reports a PMO needs, such as Earned Value, Critical Path and milestone forecasts, usually means exporting XER or XML files and working them through spreadsheets.
Those spreadsheet cycles were brittle. Large schedule files are slow to process, formulas break when the schedule structure changes, and every reporting period starts the same manual work again. Large files could also freeze a browser or time out at the gateway. On linear infrastructure the problem is sharper: roads, rail and pipelines are managed by location as well as by time, and spreadsheets are a poor tool for showing progress along a route.
- Read Primavera XER and XML exports directly
- Earned Value with CPI, SPI and variances, plus planned versus actual
- Critical Path analysis and milestone forecasting
- Time Chainage views for linear projects
- Comparison across multiple baselines
- Process large schedule files without freezing the browser or timing out
What I built
I built the platform, Anvelo Reporting, with a Django REST Framework backend on PostgreSQL, a React 18 and Tailwind CSS front end, and AWS Cognito for sign-in. The core of the product is the schedule parser: it ingests Primavera P6 XER and XML exports and turns them into structured activity data the analytics can work on.
Parsing is the expensive part, so it does not happen inside the web request. Celery workers backed by Redis take the parsing and transformation work off the request path and process files chunk by chunk. That is what stops large schedules freezing a browser or hitting a gateway timeout: the upload returns straight away, the work runs in the background, and the dashboards are ready when it finishes.
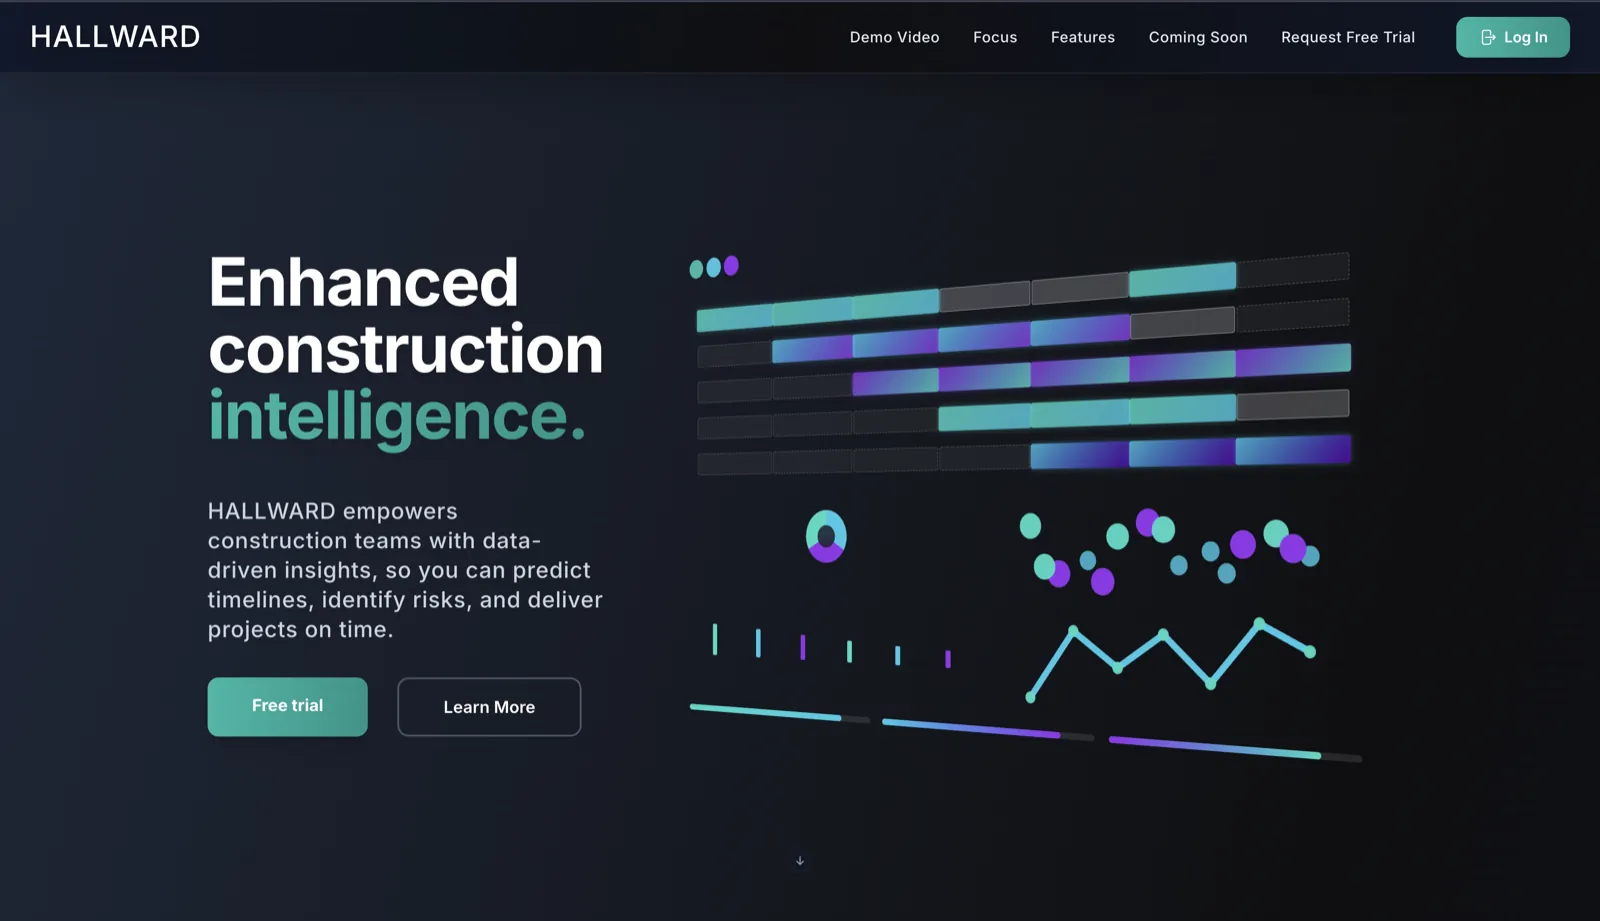
On top of the parsed data sit the dashboards PMO teams use: activity analysis, Earned Value with CPI, SPI and variances, planned versus actual, Critical Path, Time Chainage, the Milestone Tracker with forecasting, and comparisons across multiple baselines. Time Chainage matters for linear work because it shows progress by location along the route as well as by date.
AI-assisted activity categorisation groups schedule activities for linear infrastructure projects, and AI-assisted insight highlights critical activities. Categorisation is a good fit for AI here, because activity names in real schedules are inconsistent and sorting them by hand is exactly the kind of work that slows reporting down. AWS Cognito handles authentication, so access to project data is managed by an established identity service rather than custom code.
Architecture and stack
- Front end
- React 18 · Tailwind CSS
- Backend
- Python · Django REST Framework · PostgreSQL
- Background processing
- Celery · Redis · Chunk-wise file processing
- Identity
- AWS Cognito
- Project controls
- Primavera P6 (XER/XML) · Earned Value (CPI/SPI) · Critical Path · Time Chainage · Milestone Tracker
- AI
- AI-assisted activity categorisation · Critical-activity insight
Outcome
Hallward replaces brittle spreadsheet cycles with repeatable dashboards. The team uploads the schedule export and the platform does the parsing, the earned value calculations and the critical path analysis the same way every period. Because parsing runs as asynchronous, chunk-wise jobs, large files no longer freeze browsers or gateways, and reporting that used to take a week now takes minutes.
For controls teams on roads, rail and pipeline programmes, that means more time on the questions that matter: which activities are driving the critical path, which milestones are at risk, and how the current position compares with each baseline.
Because every report comes from the same parsed schedule and the same calculations, the numbers are consistent from one period to the next and across the team, which makes the dashboards something a PMO can rely on rather than reconcile.
- Repeatable Earned Value, Critical Path, Time Chainage and milestone reporting
- Large Primavera files processed in the background
- Week-long reporting cycles reduced to minutes
- AI-assisted categorisation for linear infrastructure schedules
Last updated 2026-10-03